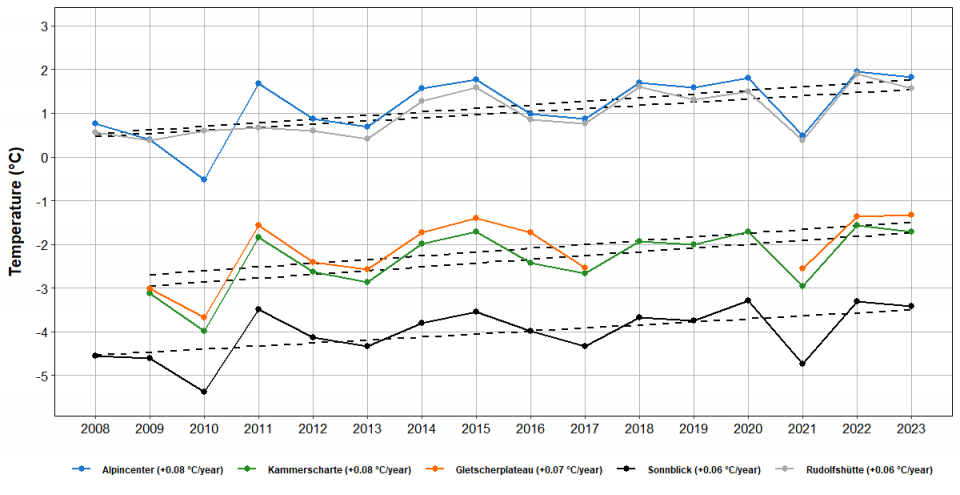
Figure 1: Mean annual air temperature measured at five local/regional, high-alpine weather stations
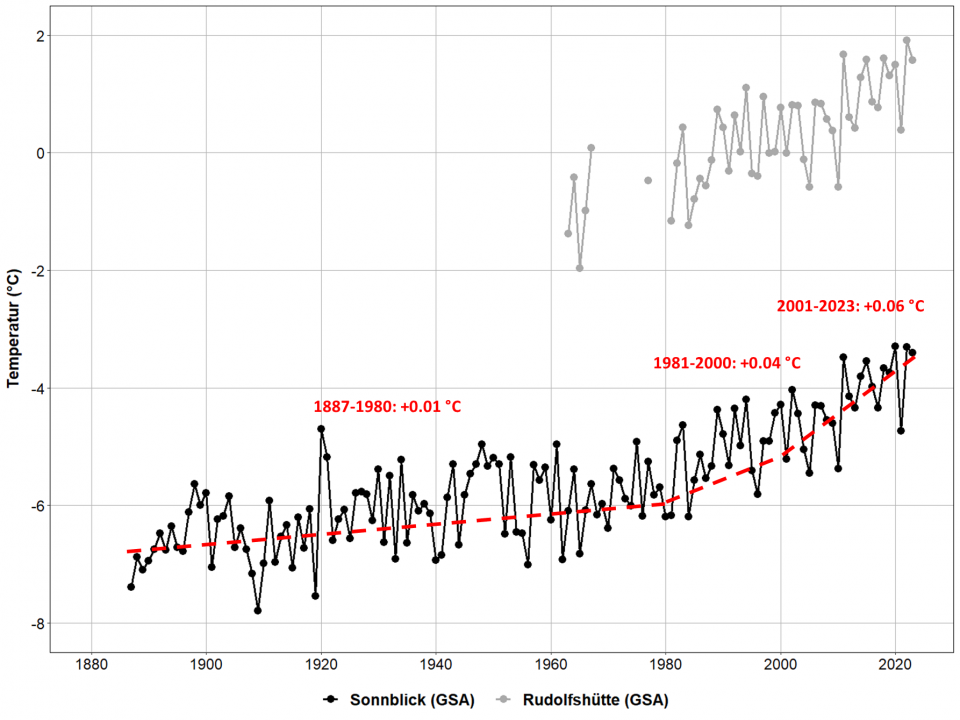
Figure 2: Long-term MAAT trend measured at Sonnblick and Rudolfshütte (GSA)
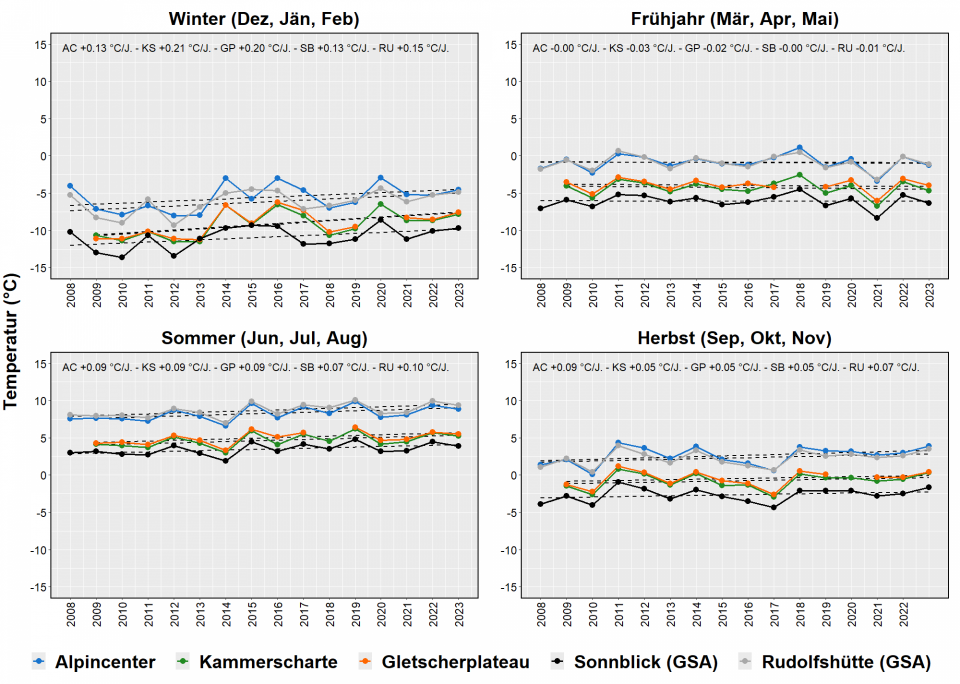
Figure 3: Air temperature trends by season (2008-2023).
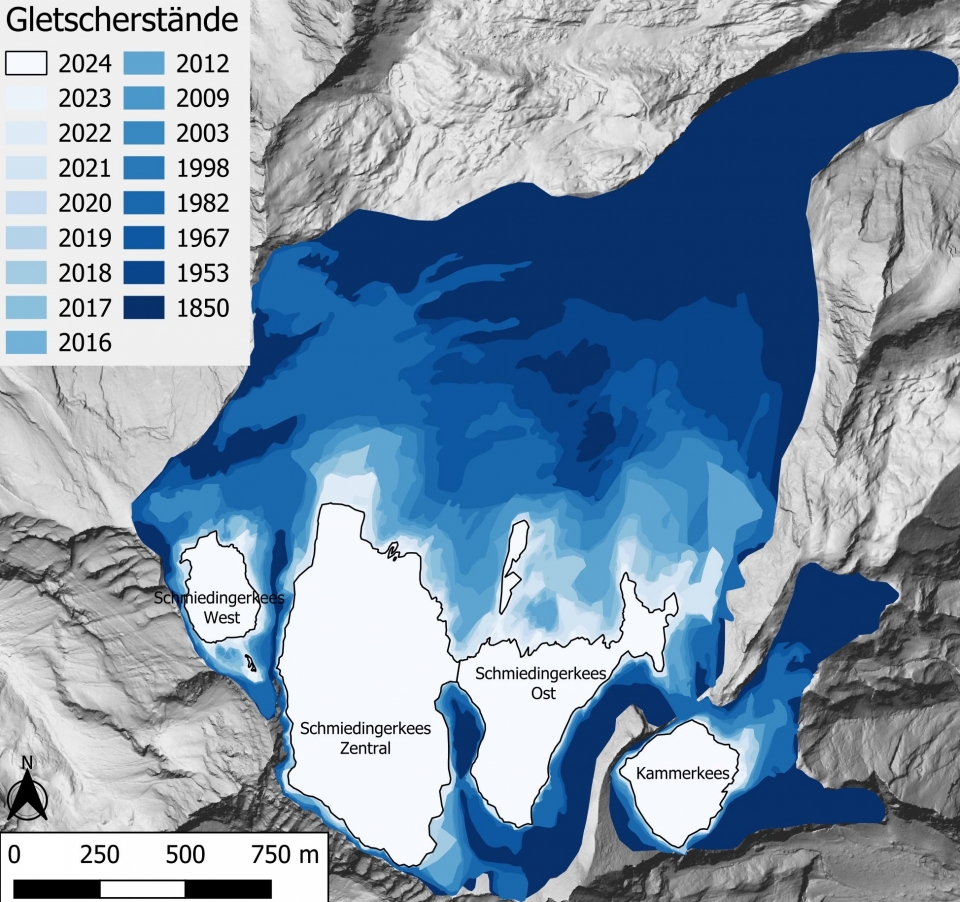
Figure 4: Glacier extent of Schmiedingerkees 1850-2024.
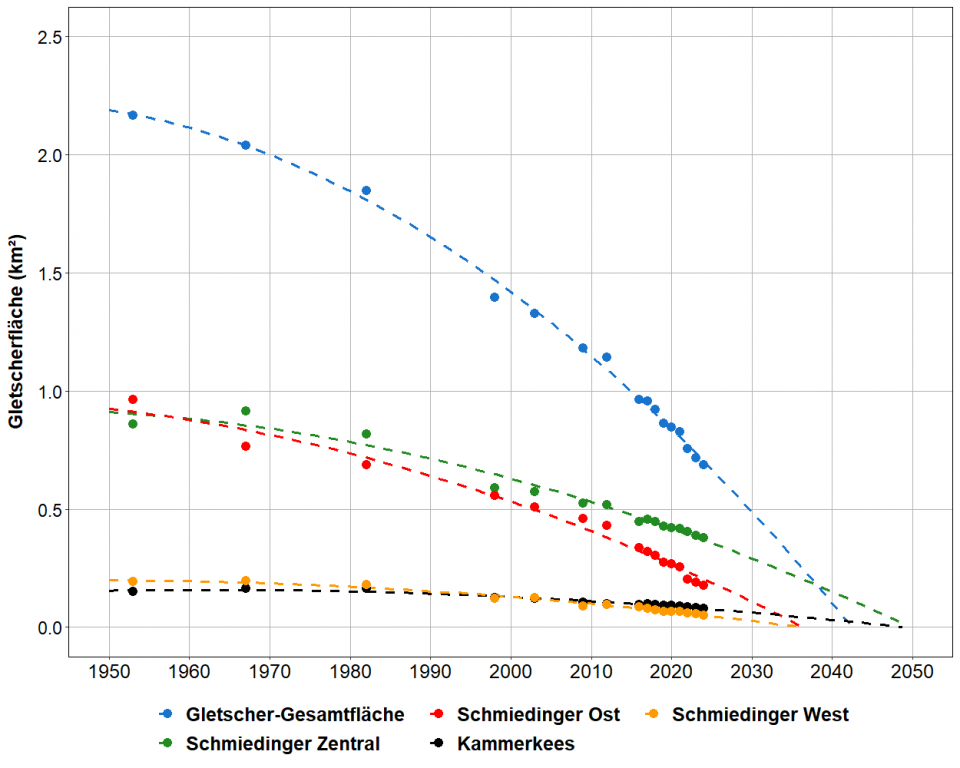
Figure 5: Evolution of glacier area 1850-2024.
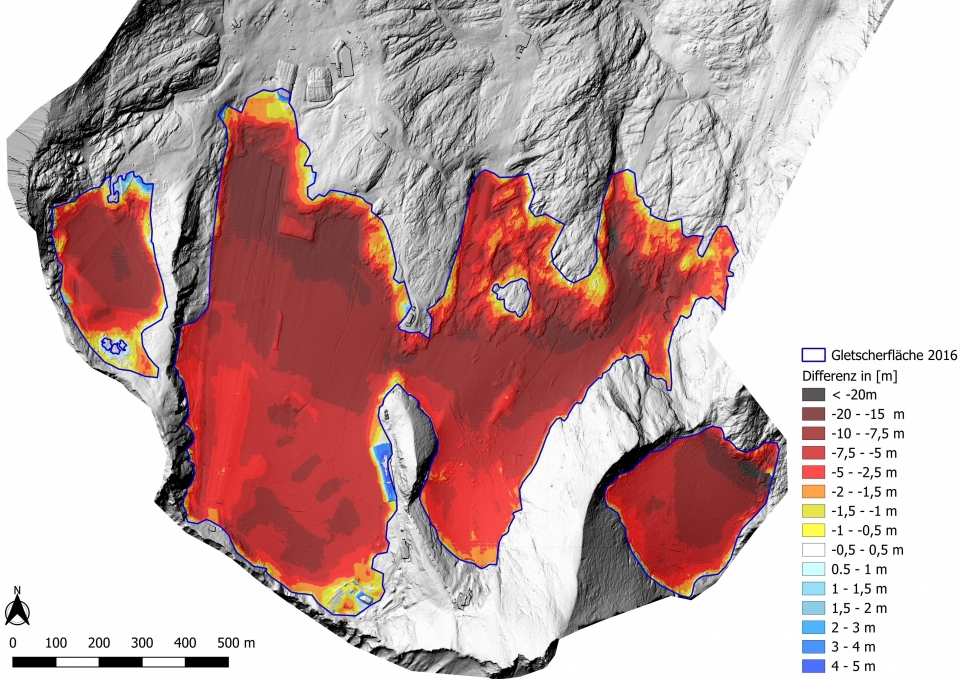
Figure 6: Change of surface elevation at Schmiedingerkees 2016-2024. Total volume (2024): 15.4 mio. m³. Volume loss since 2016: -8.3 mio. m³ (-35%). Mean ice thickness reduction per year: -1.6 m.
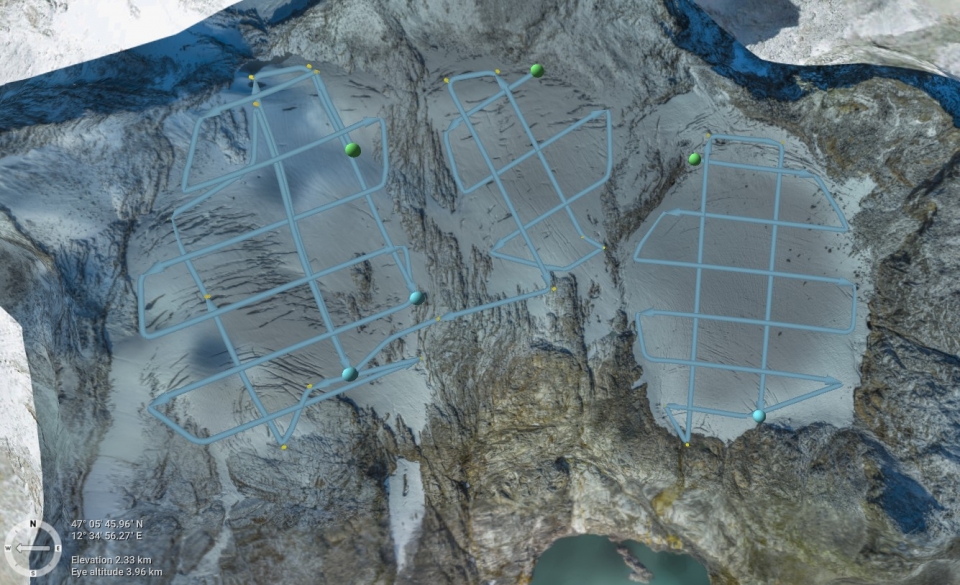
Figure 7: Flight plan for UAV-borne GPR mission to measure ice thickness at Stubacher Sonnblickkees.
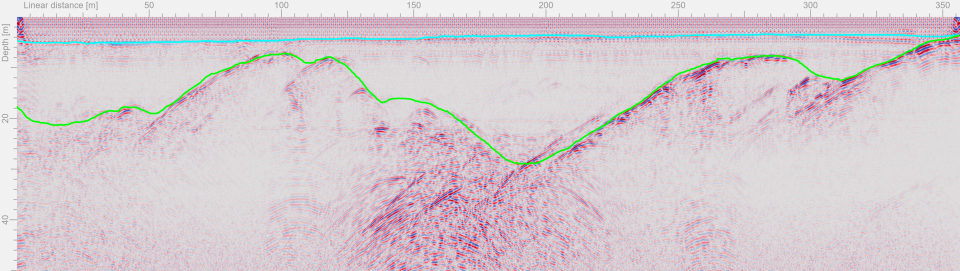
Figure 8: Radargram from UAV-borne GPR mission at Stubacher Sonnblickkees.
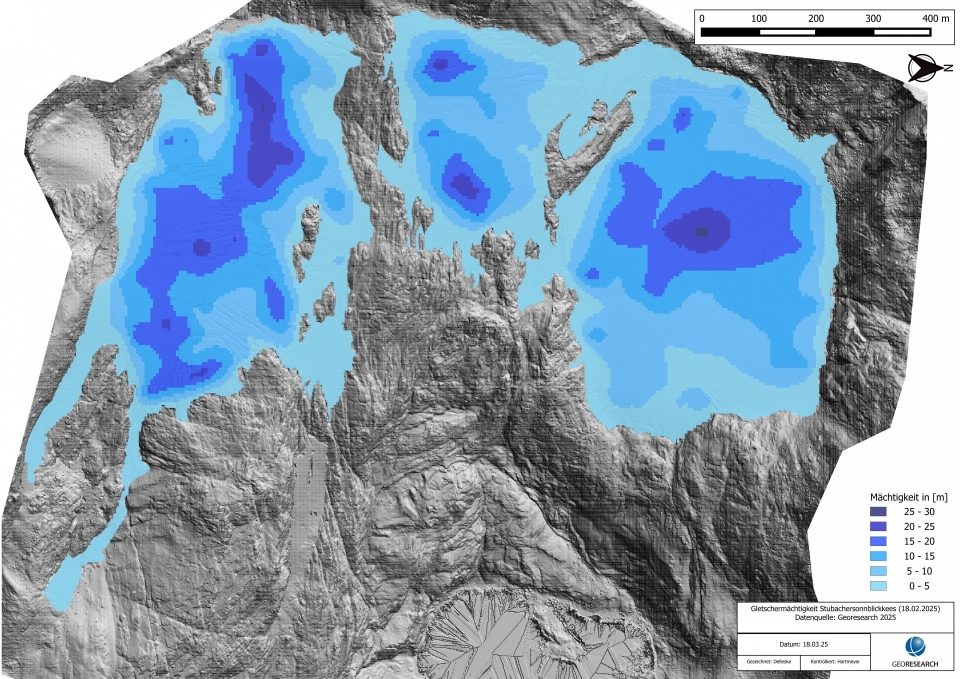
Figure 9: Map of ice thickness derived/interpolated from UAV-borne GPR mission on 18.02.2025 at Stubacher Sonnblickkees
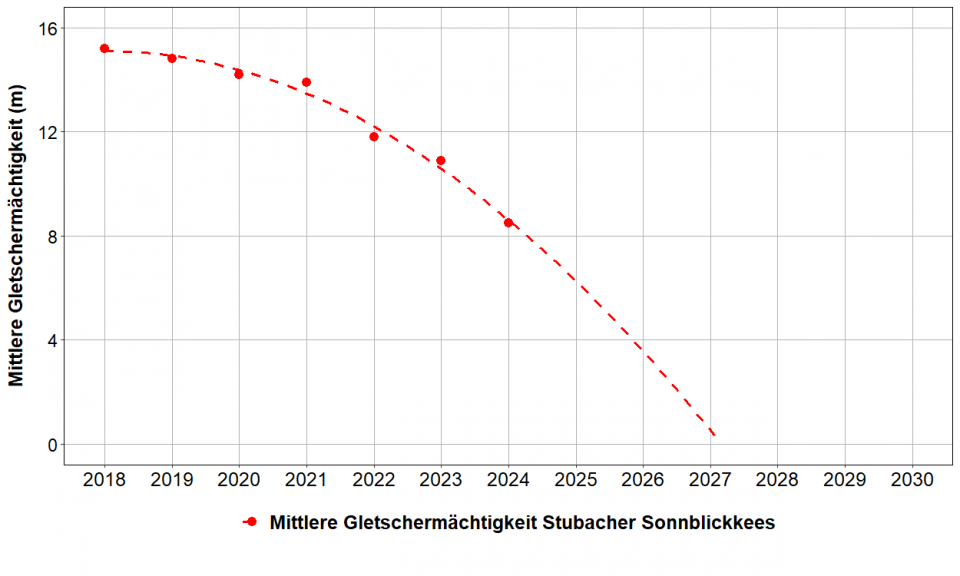
Figure 10: Evolution of ice thickness at Stubacher Sonnblickkees (2018-2024).
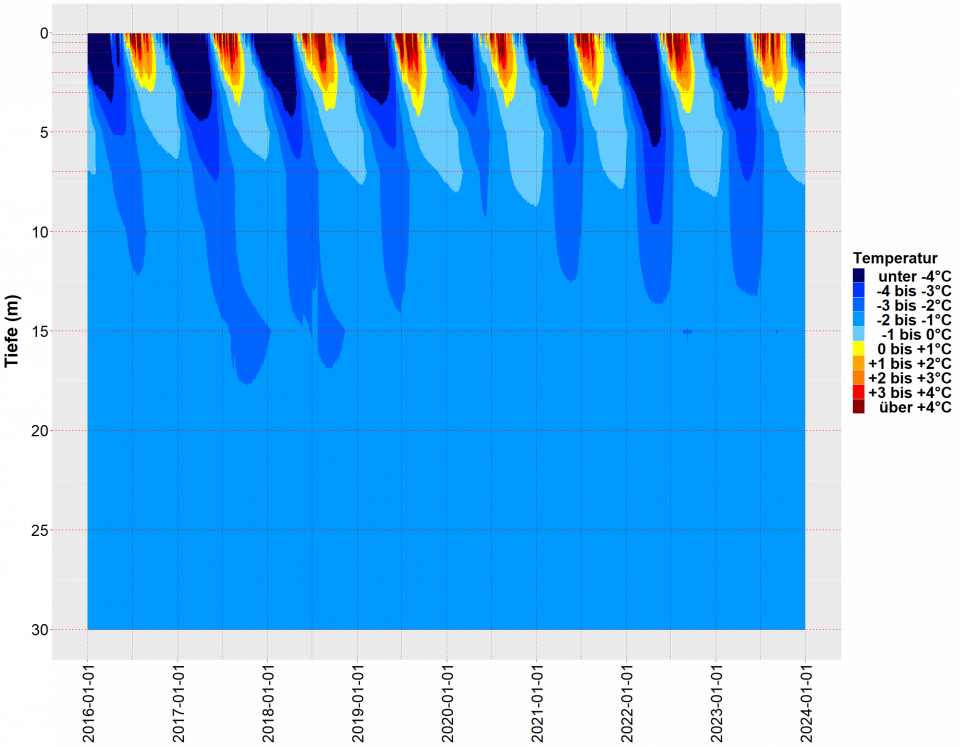
Figure 11: Interpolated temperature measured at borehole B2
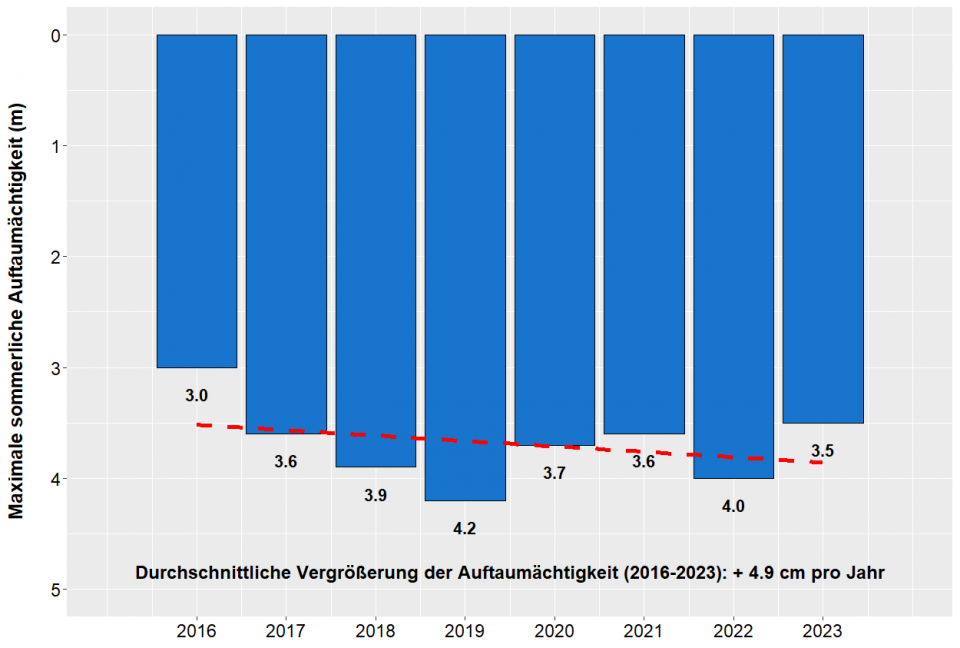
Figure 12: Active layer deepening at borehole B2
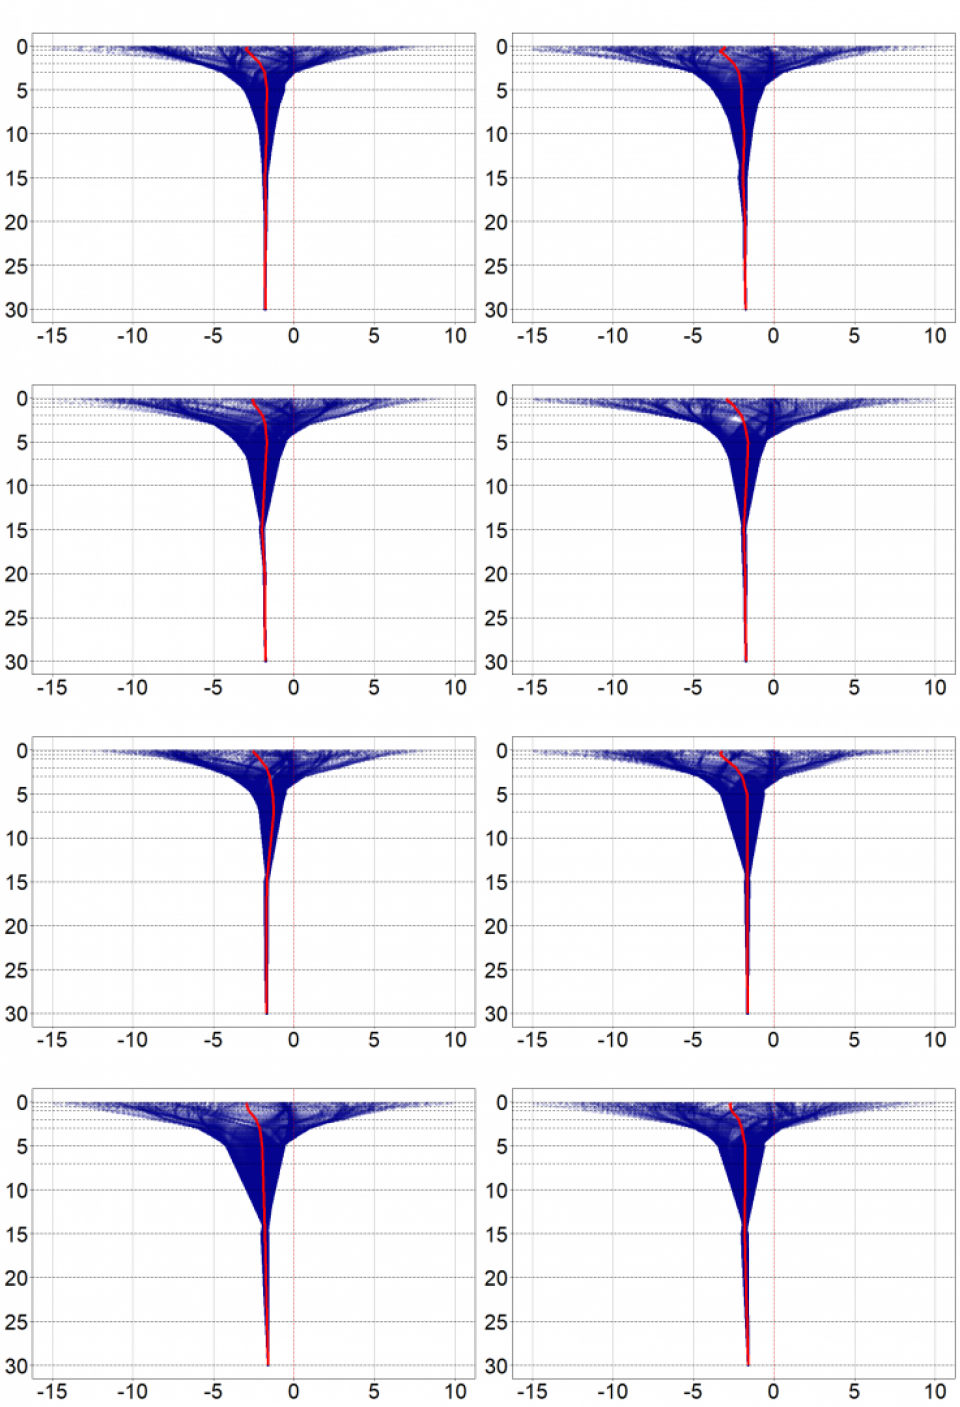
Figure 13: Trumpet curves for borehole B2 (2016-2023).
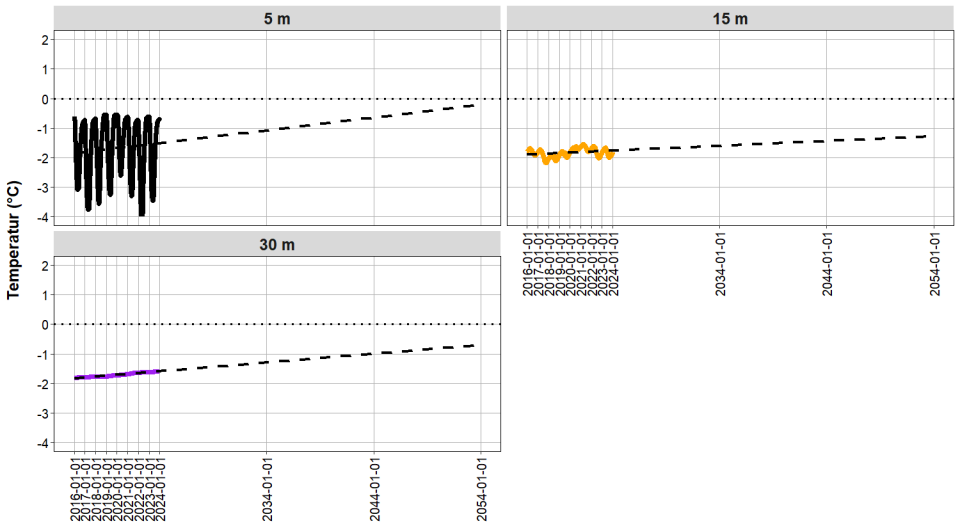
Figure 14: Extrapolation of subsurface temperature measured at borehole B2.
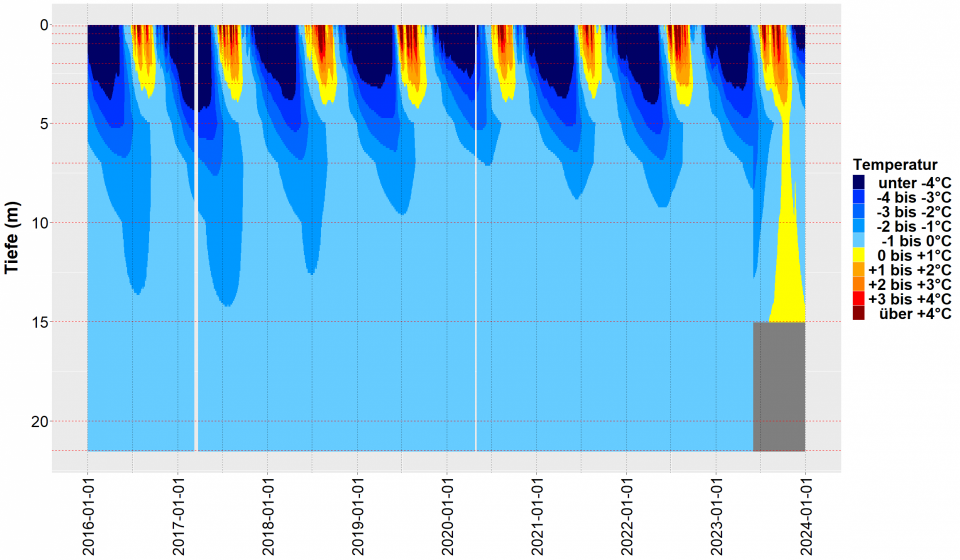
Figure 15: Interpolated subsurface temperature measured at B1 (2016-2023).
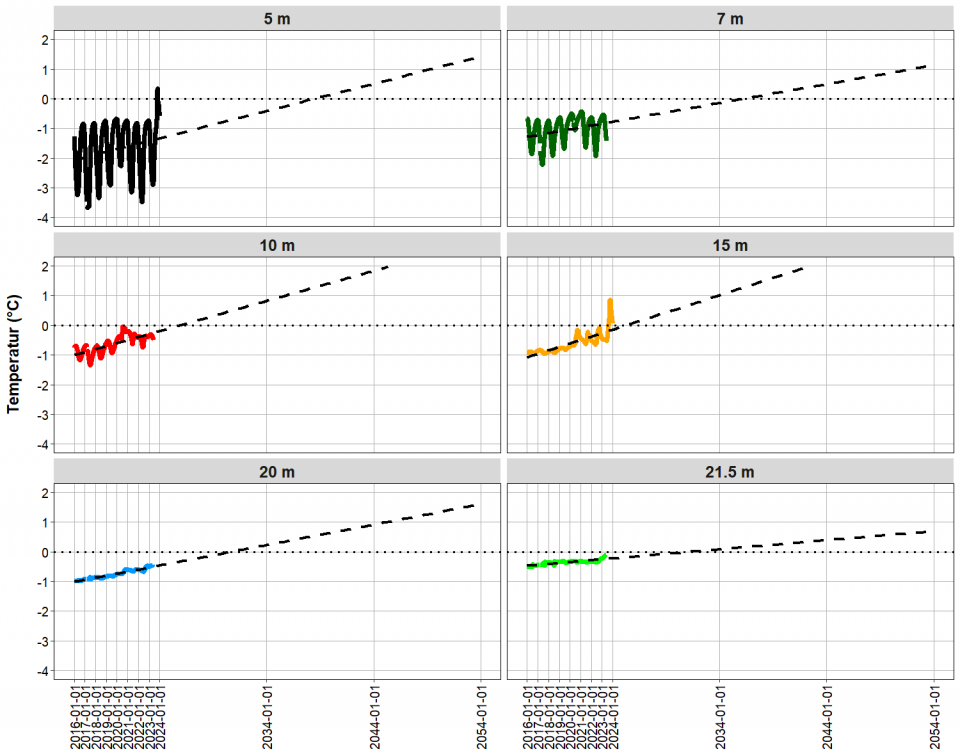
Figure 16: Extrapolation of subsurface temperature measured at borehole B1.
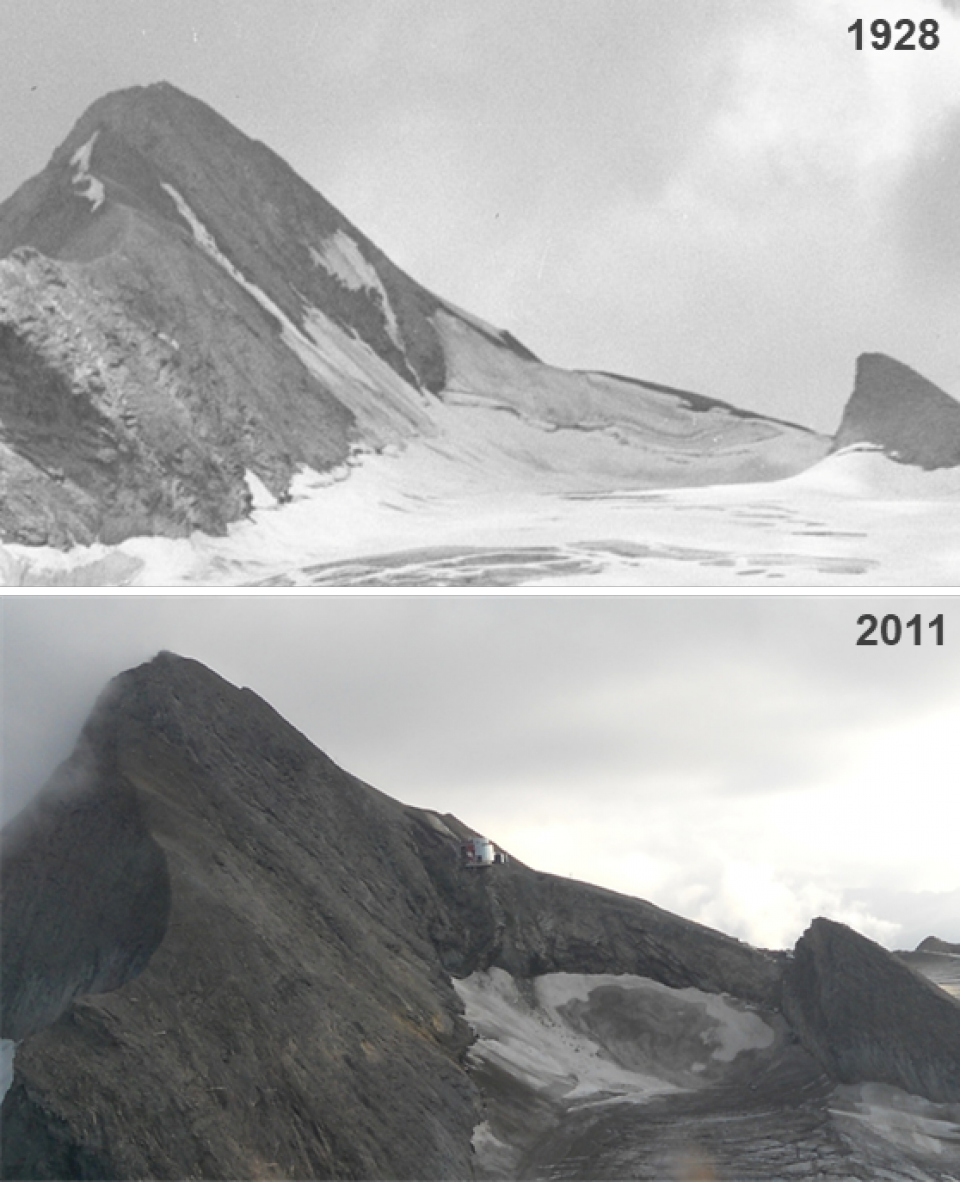
Figure 17: Glacier retreat 1928-2011.
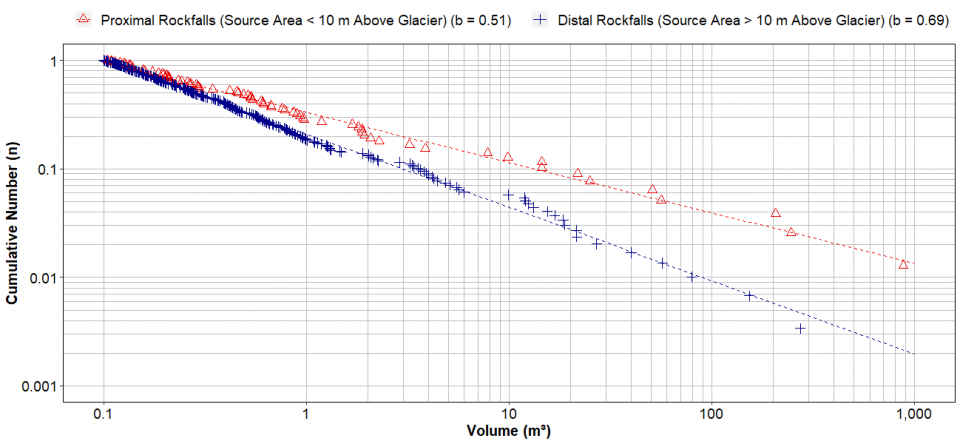
Figure 18: Frequency-magnitude plots of glacier-proximal and glacier-distal rockfalls.
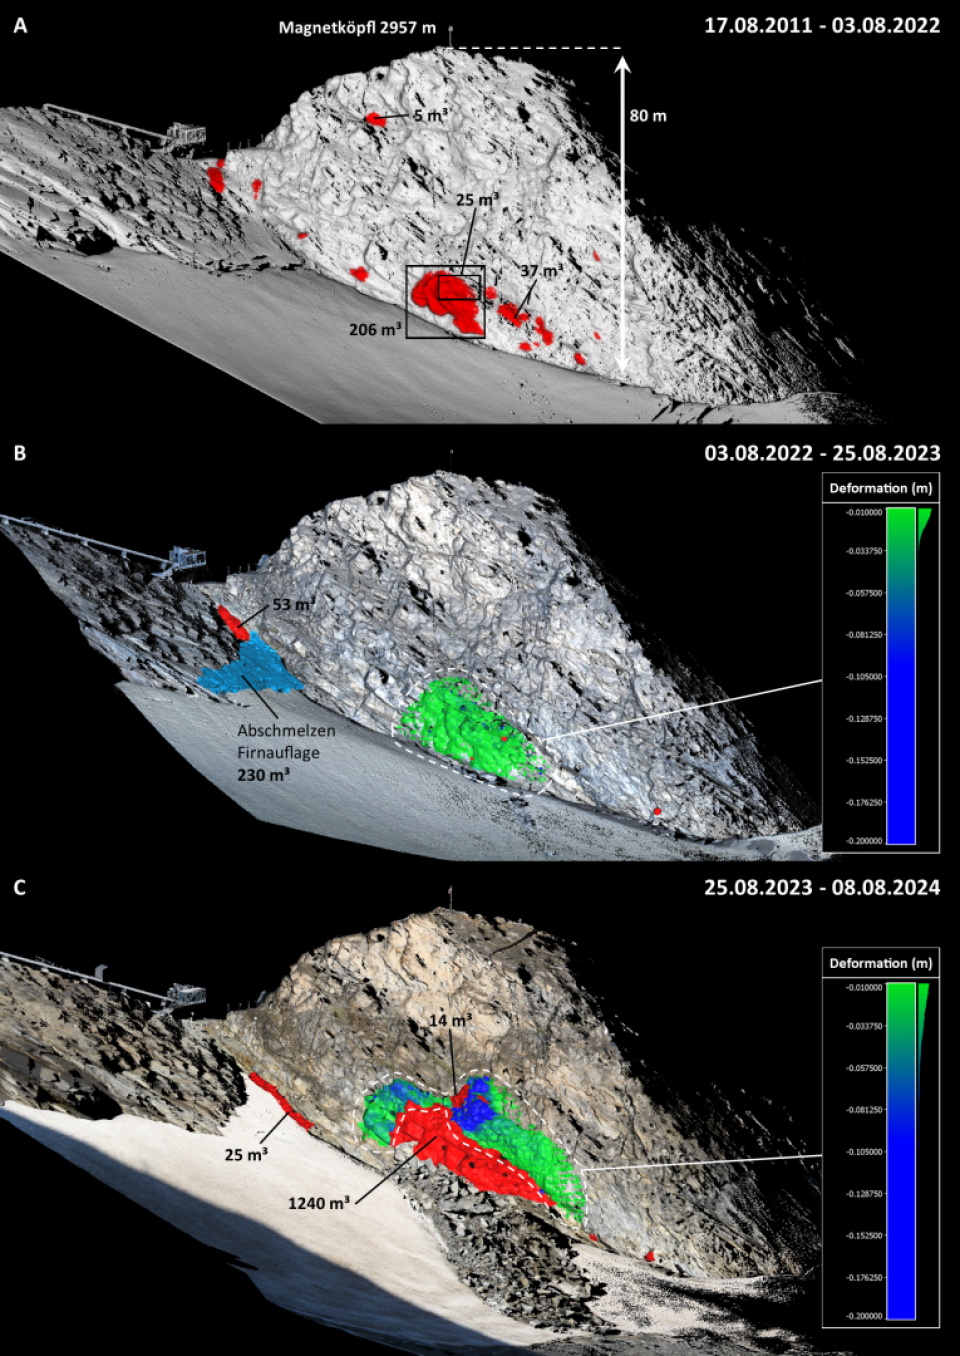
Figure 19: Precursory deformation and rockfall activity at Magnetköpfl east-face.
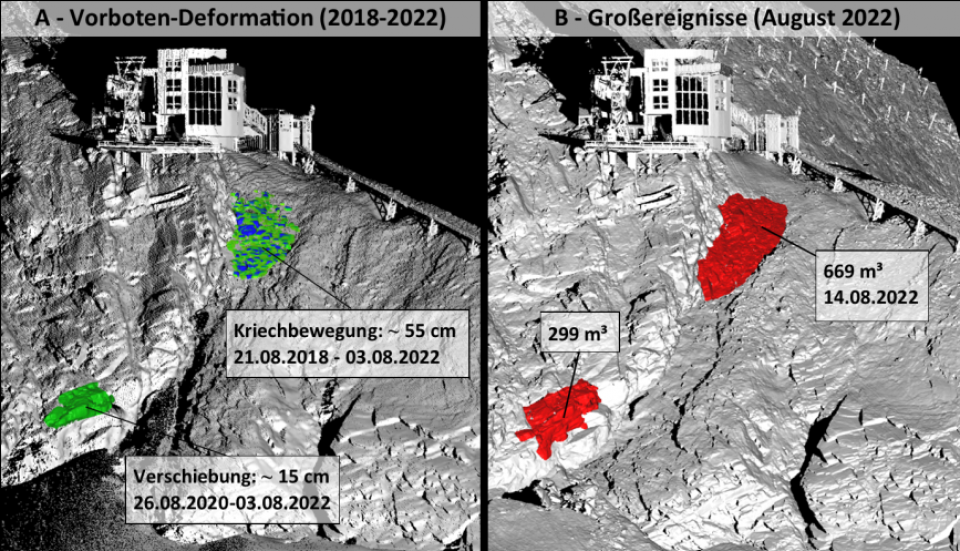
Figure 20: Precursory Deformation and rockfall activity in the vicinity of the cable car top station.
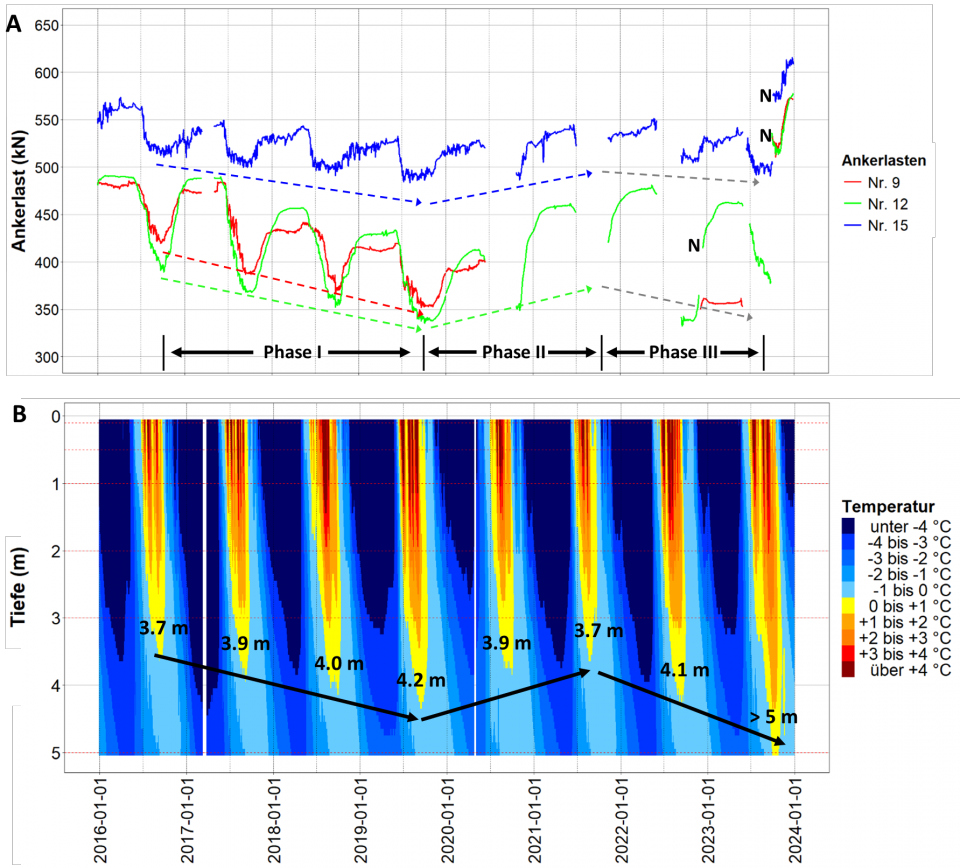
Figure 21: Anchor load monitoring 2016-2023.
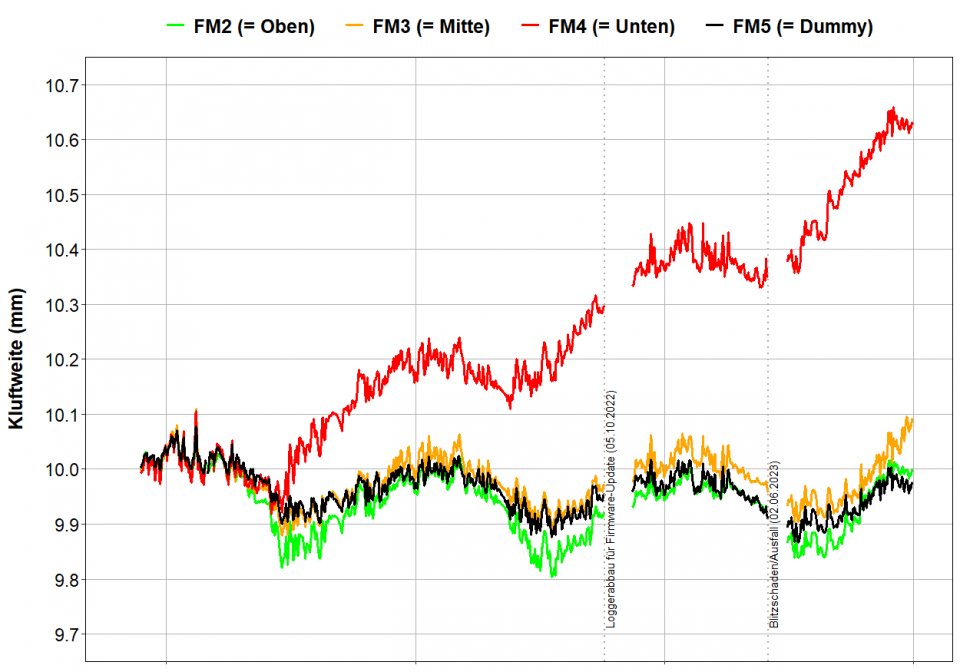
Figure 22: Crackmeter monitoring at Kitzstienhorn north-face (2020-2023).
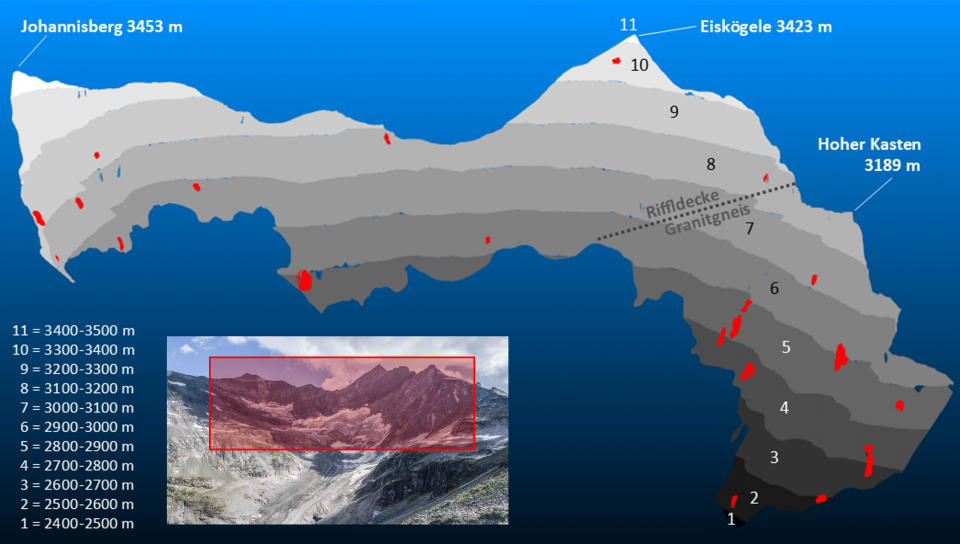
Figure 23: Rockfall distribution at Ödenwinkel cirque
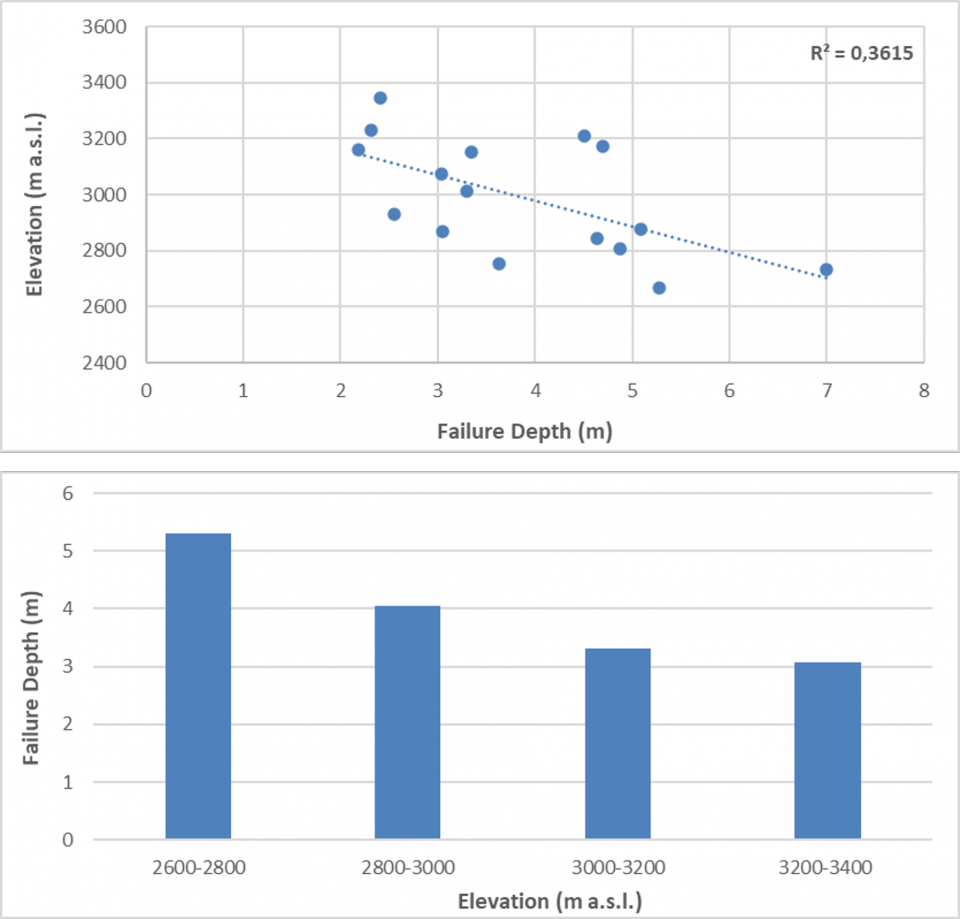
Figure 24: Elevation-dependent rockfall failure depth.